Generation of Dataset for Mapping
To generate a dataset for comprehensive testing of mapping software, a single high-resolution image of the St. Mary’s County Regional Airport was captured using Microsoft Flight Simulator. This image, with a native resolution of 3840×2160 pixels, was systematically divided into smaller image tiles using a sliding window approach with a configurable overlap.
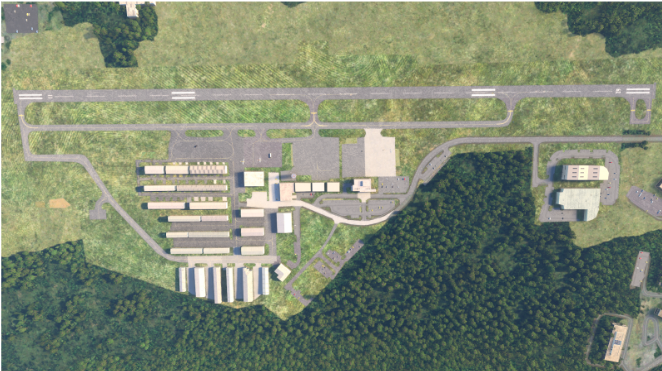
Input High-Resolution Image
The tiling process allowed for custom tile sizes and overlap percentages. The stride used in tiling was determined based on the overlap percentage as follows:
Stride_x = tile_width×(1−overlap)
Stride_y = tile_height×(1−overlap)
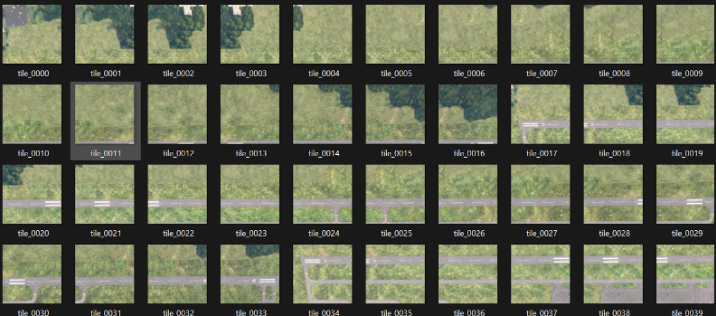
Output Tiles (for Overlap = 60% and Resolution = 512x512)
Additionally, a zigzag scanning pattern was applied, alternating the tile extraction direction (left-to-right, then right-to-left) for each row. This simulated realistic flight path or mapping scenarios and preserved spatial continuity across the dataset.
The final dataset included multiple sets of image tiles with varying:
-
Overlap ratios
-
Number of images per set
-
Effective resolutions
Testing of the Software
The generated images were used to test the softwares like WebODM and Autostitch over different parameters like time taken to stitch, quality of the stitched map for different overlap percentage and resolution images.
WebODM
WebODM testing involved uploading the generated image tiles at different resolutions and overlap ratios into separate WebODM projects. Each dataset was processed using default settings with minor tuning for optimization. Processing time, system resource usage, and output quality were recorded for each case.
Tests were run with 512x512 and 1024x1024 resolution datasets at 10% to 60% overlap (in 10% steps). For each setting, the orthophoto and 3D model outputs were evaluated. It was observed that:
- Higher overlaps led to better map alignment but significantly increased processing time.
- WebODM performed better with images having preserved EXIF metadata (simulated), enabling more accurate georeferencing.
- Datasets with zigzag tile ordering preserved continuity and yielded smoother outputs.
The results confirmed that WebODM is highly sensitive to input data structure and benefits significantly from consistent overlap and tile arrangement.
Autostitch
Using Autostitch was a simple process — the software was opened, and all images from a folder were selected. Tests were done using two resolutions: 1024x1024 and 512x512 pixels. For each resolution, images with overlap percentages ranging from 10% to 60% (in steps of 10%) were stitched. The time taken for each stitching process was recorded.
A plot was created showing how the time varied with overlap percentage for both resolutions. It was observed that higher resolutions and greater overlaps generally led to longer processing times.
Another test was conducted comparing two image naming styles:
-
Randomly named images
-
Sequential (zigzag) order
This was to check if naming or order affects Autostitch’s performance. The software was able to stitch in both cases, but results may vary slightly in speed or stitching accuracy depending on the naming order.
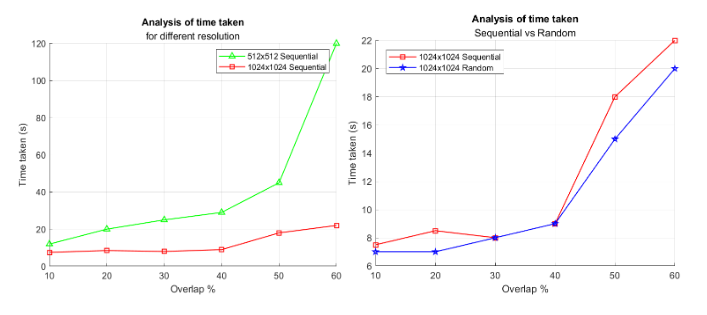
Using Autostitch, images were stitched at two resolutions: 1024x1024 and 512x512, with overlap percentages ranging from 10% to 60% in steps of 10%. Interestingly, the higher resolution (1024x1024) images stitched faster than the lower resolution ones due to the smaller number of images involved. A general trend of decreasing time with lower overlap percentage was observed, although the time stabilized at lower overlaps. Additionally, testing with random and sequential (zigzag) naming of images showed that naming order had minimal impact on stitching time.
Quality of the stitched images were evaluated visually using 3 major parameters : Projection Accuracy, Stitching Quality and Visual Quality
The stitched outputs from Autostitch across different overlap percentages and resolutions appeared visually quite similar. The only notable exception was at 10% overlap, where the software was unable to generate a proper stitched map.